Home Buying · home selling · Living in Minneapolis

March Real Estate Market Update

My last post & video about this were pretty well received, so even though numbers aren’t flashy, I’m going to try to make this a monthly feature as we navigate through this crazy market. This post has some good little nuggets in it if you’re in certain segments of the market, so stick with me.

A bright spot for buyers?!!

Last time I posted about the market I gave an overview of “absorption rates”, this is going to be a recurring theme, so if you want to check that out you can find that post here: https://twin-cities-living.com/2021/02/26/i-had-other-plans-for-this-weeks-post/

There is an obvious lag in the data because we need to look after homes close and that shows up in the MLS, but I do get some data relatively quickly thanks to Minnesota Transaction Coordinators, a company that helps many of us with processing our transactions.

Let’s start there with their analysis of terms that they see in contracts.

Inspections

In the past couple of months we’ve seen quite a few buyers deciding to waive the inspection in order to release one more contingency ahead of everyone else. By “a lot” I mean 38% of buyers were waiving inspection in the first 2.5 weeks of the month, but when they looked at the first through the 26th the rate went to 31%. That means that enough people have STOPPED waiving them to lower this percentage by 7%. Buyers are insisting on protecting themselves and sellers are acquiescing to that.

Offer acceptance rates

Even better, offer acceptance has gone from 31% for the month last week, to 39% for the month over all as of the 26th. YAY!!!! Sellers are accepting offers! I represent a lot of buyers and it has just been TOUGH. So this is great news.

Homes listed on the open market vs witheld

In an office as large as mine, we often hold listings off market and only market to agents within the office. This shrinks the pool of who looks at the house which is desirable for a lot of reasons – from Covid, to privacy, to simply wanting to not have to deal with the preparation and hassle of selling on the open market. Sellers can name their terms and if another agent has a buyer that can meet those, there is a happy meeting of the minds without all of the associated prep work, exposure, etc and everyone feels satisfied. The number of sales that they have worked on in this status is down to 5.6%. This is good because more homes are hitting the market than have been.

Percentage of list price received

Current purchase price to list price ratio is “down to” 104% from 105% last week. It has been hovering between 103% and 105% in the past couple of months. It’s good to have that number in mind, even though it’s not a fixed price, it’s an idea of what you should think about when offering on a property that has a lot of interest. Price is not the entirety of a an offer, there are a lot of other terms that need to be in line as well, but this is good info for this metric.

Seller paid closing costs

26% of deals include some seller paid closing costs. I have to assume in this market that the offer price was increased to account for these, but I like that we are seeing it because it means sellers are accepting these terms.

Forms of financing

76% of loans are conventional (you do NOT need 20% down for a conventional loan! These are viewed as more favorable and if you can get a conventional loan it’s one more check mark on the list of terms).

FHA loans represent 10% of the offers, CASH 10%, and VA & USDA loans are at 4%.

Traditionally, inventory really increases around this time of year (inventory = homes being listed and available for sale). We currently have less than HALF of the listings we had 6 months ago.

Good news for downtown condo buyers!

Downtown condos are in a balanced market right now! If you are looking for a condo in the central city including neighborhoods like Loring Park, Downtown, University, Dinkytown, Elliot Park etc… now is the time. We believe that this is caused by the pandemic and people wanting to live in less dense housing + fewer people needing to be downtown for work, but don’t expect it to last with the speedy rollout of vaccine and life returning to somewhat new normal.
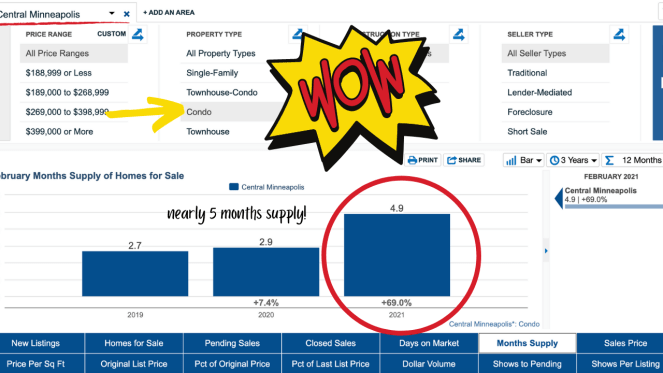
Days on Market are up to 41 (only from 38), but these are the kinds of indicators that let buyers know that they will not likely have to pay more than list, that sellers will be willing to negotiate because they know you can find another condo to buy and someone will play ball with you.

So that is what is happening! Sellers are still mostly in control of things, but if you’re a downtown condo buyer you’re in the sweet spot!

Let me know if you have questions.

Home Buying · home selling · Uncategorized

I had other plans for this week’s post…

Next week I’ll give you another neighborhood profile – I’m excited about my small town series, and I have one I love and plan to talk about, but this week I’m going to beat a dead horse a bit and talk some more about what is happening in the real estate market in the Twin Cities metro area. I don’t usually do “market update” posts or videos on my YouTube channel, but the fact of the matter is that right now I’m actively helping 6 buyers try to navigate this market and I want to share a bit of how we look at the market and measure it and then also show you what that means for the Twin Cities right now.

I swear … it was this big!

I feel like anecdotal evidence about how many offers a listing gets, how fast something sells or how far over list price the offers are is shocking at times or maybe sounds like a fish tale that we like to tell – “the big one that got away” kind of thing. Stories are great and interesting, but in this post I want to talk about DATA. Weee! Exciting!

Not exciting? Well, I disagree. I think this tells a very clear story and because it looks at the entire market and then breaks it down by price it might tell the story in a way that makes sense in a different way to more people. This is the WHY behind the HOW that I’ve talked about before when I’ve done videos/posts about making the best offer.

How DATA tells you if it is a buyer or a seller’s market: Meet the “Absorption Rate”

These are my words, not something from a real estate dictionary somewhere.

When we look at a market and try to decide who it favors we look at the number of active listings available in a 30 day period and then look at the sales. It’s a ratio. But the way that I think is easiest to visualize this ratio is as the “absorption rate”. This rate shows us how long it would take for ALL houses actively listed to be sold if NO OTHER homes were put on the market during that time.

We are measuring time in months for this exercise, and the magic number of months where REALTORS feel that the market is in balance is 5 (not set in stone, some argue for 6 months etc). This means that when it would take 5 months for every home to be sold should no other homes be listed, the market does not favor either a buyer OR a seller.

Any number smaller than 5 indicates a sellers market. The smaller the number the more it favors sellers. This works in the converse as well, the LARGER the number over 5 the more the market favors buyers.

What is the Twin Cities absorption rate today?

Emphasis on TODAY because this rate changes seasonally and with market forces – I’ll talk a bit about what those are too.

The current absorption rate for the Twin Cities metro is 0.86. LESS than one month’s supply of homes. Very much in the favor of the seller. And it is not getting better – in the past 6 weeks the rate has consistently decreased from 1.32 the first week of January to where we are today.

The last half of 2020 was a crazy market, due to Covid hitting in spring and the uncertainty that brought with it there was a lull in what would typically be the busy spring market, but once everyone got their bearings it was off to the races and it never really slowed, even during the holidays. Add extremely low interest rates into the mix (under 3% for a pretty extended stretch), and a bubble of Gen Y aging into home ownership and bumping up what was already high demand from buyers, and things have just not cooled at all. All of this to say we sold a LOT of homes last year and possibly ate into what would have been inventory for this year. January 2021 started with 38% FEWER listings than we had in January 2020.

Supply continues to drop, particularly in the under $300K price range where new listings are down 15% YTD. The over all market YTD has 6.9% fewer listings. If you’ve taken any economics classes at all you’ll know that price is a function of supply and demand. We have low supply and high demand and that is pushing prices higher as people bid against each other for homes.

Absorption rate by price point

The best way to show this is to give you a screen shot of the table that we looked at in our data meeting this week. I love this table because it breaks it out by general price points and you can see the trend over the past 9-10 months for each. You’ll notice that higher price points have slightly looser markets because there are fewer buyers that can manage those budgets. I do think that the $500-$1M may need to be broken up a bit because at $500K there is still a quite a large bubble of buyers that are able to enter the market and compete for homes at that price. There may be a break closer to the mid $600’s where the ratio gets closer to 1.4, but I think $500 is still quite competitive.

credit to Tim Sipprell who pulled this together for our office
baby data geek

So, that is the data geek light version of the market at this point in time in the Twin Cities. An opportunity again for me to encourage you to be as prepared as you possibly can be before you enter the fray. You really need to be in the best position possible if you want to land at the top of the heap when you get into this market.

Let me know if you have questions… 🙂