More Homes. Less Pressure. But Still a Seller’s Market?
If you’ve been watching the Minneapolis housing market over the past few years, you might be wondering: is this finally the shift we’ve been waiting for? In short — kind of!
Here’s what I’m seeing on the ground (and in the numbers) right now as of July 2025.
📈 Inventory Is Rising — and That Matters
We’ve seen a 31% increase in listings since the start of the year, and there are now about 7,300 active listings in the 7-county Twin Cities metro. That’s nearly 1,000 more homes than this time last year.
More homes on the market means more choices — and a little less panic — for buyers.
Almost every county is now over 2 months of housing supply:
- Anoka and Ramsey Counties are still under 2 months.
- Carver County is leading the pack at nearly 3 months.
📊 Quick Inventory Refresher:
- 0–5 months = Seller’s market
- 5–6 months = Balanced market
- 6+ months = Buyer’s market
So yes, we’re still in a seller’s market technically… but emotionally, it feels like a big relief for buyers compared to the frenzied pace of the past few years.
🧭 Buyer Experience: More Room to Breathe
If you’re coming from out of state — especially places where homes are lingering on the market or negotiation cycles are long — the Twin Cities might feel strange.
We still see multiple offers. Especially for homes that are:
- Closer to the city
- Priced right
- In “1 out of 10” condition (mint and move-in ready)
Those homes? They’re flying. Still.
But listings that need a little TLC, staging, or smart pricing? Buyers are negotiating, and sellers are making concessions.
💡 What Accepted Offers Are Looking Like Right Now
The transaction coordination team I use (Home Free TC) provided a quick market snapshot based on 47 accepted offers between July 1–11, 2025. It’s a small sample, but all from busy, high-volume agents:
- 15% of buyers waived inspections (that’s way down from the last few years)
- 21% were cash offers, 70% conventional financing
- Median sale-to-list price: 100%
- 28% of offers included seller-paid closing costs
- Only 4% used escalation clauses, and just 8% included appraisal gap coverage
- Home warranties included in 11% of deals
- Cancellation rate: 2%
Takeaway? The market is calmer. Strategic. Thoughtful. But good homes still move fast.
🏠 How Property Types Are Trending
🔹 Single-Family Homes:
- Median price: $415,000
- YOY increase: +3.8%
- Median days on market: 14 (including inspection!)
Most homes go under contract within the first week.
🔹 New Construction:
- Median price: $595,000
- YOY increase: +4.9%
There’s more supply than demand here, which means more negotiating power for buyers. A great opportunity right now.
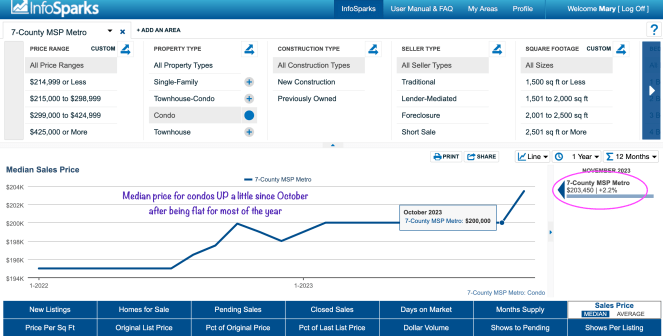
🔹 Condos:
- Median price: Just over $200K
- Flat pricing, and days on market are increasing.
Supply > demand = slower sales.
🔹 Townhomes:
- Median price: $310,000
- Median days on market: 30
Townhome prices are holding steady, but longer market times are giving buyers a bit more wiggle room.
💬 So… Is It a Buyer’s Market Yet?
Not quite — but we’re headed in that direction, and it feels a whole lot better for buyers than it did even a year ago.
If you’re thinking about buying, there are real opportunities right now.
If you’re selling, presentation and pricing matter more than ever — but you still hold strong ground.
🤝 Want Help Navigating This Market?
Whether you’re relocating, downsizing, upsizing, or just exploring options — I’m here to help. I’ve worked with clients all across the country and love helping people figure out whether Minnesota is their next home.
📩 Feel free to reach out — mschumann@kw.com or call / text 773-791-2015
Thanks for reading!
– Mary Schumann