As we approach the end of the year in Minnesota, the rhythm of life shifts. The days get shorter, the temps get colder, and people settle into the cozy rituals that make winter here feel special. And right on schedule, the real estate market slows down, too.
But slowing down doesn’t mean declining. In fact, the Minneapolis–St. Paul market remains one of the strongest and most stable in the country, especially when you focus on the 7-county metro, which is where most buyers want to be.
Here’s what’s happening right now — and what it means for buyers and sellers heading into 2026.
For previously owned single-family homes, the year-over-year appreciation rate is 4.5%. This is exactly where we want to be — growing, but not overheated.
Some markets around the country are seeing price declines. We are not.
Home prices here continue to hold their value, even when individual listings make price adjustments.
A Spotty, Discerning Market
The 2025 market is unusual — but honestly, when hasn’t it been?
Here’s the pattern we’re seeing:
Homes at or below the median price point often sell quickly and may receive multiple offers.
Higher-priced homes have a smaller buyer pool and may sit longer.
Across all price points, buyers are becoming more selective. They want move-in ready. They want value. They want fewer reasons to hesitate.
For sellers, this means preparation matters more than ever. Removing objections before buyers walk in the door is critical.
Current Prices and Inventory Levels
Previously Owned Single-Family Homes (7-County Metro)
Median price: $418,000
Average price: ~$508,000
Months supply:1.7 This number has not budged in more than a year.
Anything under 5 months of supply is considered a seller’s market, and we are firmly in that territory.
New Construction
Median price: $600,000
Average price: ~$713,000
YOY appreciation: 6%
Months supply: ~6 months
New construction is a balanced market, offering buyers an abundance of choice—but typically with trade-offs, including larger homes on smaller lots and landscaping that won’t feel mature for years.
Why Winter Is One of the Best Times to Buy
If you’re planning to buy at all, winter often provides the strongest buyer advantages:
More motivated sellers
Less competition
More negotiation power
More time to make decisions
Less pressure to waive protections
You can often secure a lower price in November or December than you can in the spring, when additional buyers flood the market.
Looking Ahead: Predictions for 2026
The Chief Economist for the National Association of Realtors predicts a 16% increase in home sales next year, assuming the Federal Reserve reduces interest rates as the economy cools.
If interest rates drop to around 6% or below, demand could skyrocket.
That sounds great for affordability — but keep in mind that lower rates also mean more competition. Prices and bidding activity typically rise when buyer demand returns in force.
And remember: Minnesota’s spring market starts in January.
Every year, without fail.
If you’re hoping to avoid competition, winter may be your moment.
Final Thoughts
Whether you’re buying or selling, strategy is everything.
Buyers: Winter gives you leverage and options.
Sellers: Patience is key in slower segments, but demand always returns with the new year.
The Twin Cities continues to offer stable appreciation, strong demand, and a market that behaves differently from many coastal or high-volatility areas.
And if you’re relocating here — welcome. It’s a great place to be, even in the winter.
If you want personalized advice or want to start a conversation about buying or selling in 2026, I’m here to help!
I just did a video that gives real life examples of what is happening in the 7 county metro Twin Cities housing market right now and wanted to share it with you. Things have changed QUICKLY!
Let me know if you have questions about the market or how to WIN in this market. The pandemic was a good boot camp for agents that made it through!
What is happening in the Minneapolis area real estate market? I’ve been following several metrics over the past few years and there are a few that really stand out to me as indicative of how the market is doing, not just PRICE but what kinds of terms are included in winning offers and I will let you know which terms are revealing the current state of the market here.
I’m keeping my finger on the pulse of what is happening in the Twin Cities metro real estate market so you can be an informed buyer or seller.
The number one question that most people have about homes is whether or not prices are falling? I keep hearing this and for the purposes of this discussion I’m just going to look at the 7 county metro around Minneapolis and St. Paul and we can check the different housing types. The first is the most popular -SINGLE FAMILY HOMES. When I was digging into data for this update I decided to look at it over the past year and the past 10 years so that I can show you trend lines for both. I’m also going to differentiate by new construction and previously owned because new construction is at a vastly different price point as a whole.
Prices & time on market for existing homes
Metrics that I didn’t talk about in the video are how long houses are staying on the market these days. I do see houses sitting for quite a long time in certain areas and price points but the official numbers are charted here. The graph gives the impression of a big increase in time, but real numbers equate to only 3 more days.
New Construction
I’ll talk about pricing but for new construction I see a lot of opportunity for buyers here! Why? Builders have a lot of inventory right now. They have completed homes as well as homes that are underway with completion dates coming up. They need to get these homes off their books so they can continue to build and the interest rates have slowed things down for everyone, but the big builders are offering rate buy downs for buyers right now along with all kinds of other incentives, from appliance packages to closing costs.
Things to consider are that these homes are mainly being built in 3rd ring suburbs and exurbs so if proximity to the city is important you’re less likely to be able to get a new build – or at least one with a big builder that can offer these incentives. There are custom builds on lots here and there in the city.
You’ll see a slight dip in median price ($5000) from the beginning of the year. I have read in multiple sources that they estimate that it would take 10 years of building for the builders to catch up to demand for homes due to the after effects of the housing recession in 2008. We are still that far behind. New construction is showing over 6 months worth of supply but take this with a grain of salt because builders list homes that are TO BE BUILT – so they aren’t existing yet – along with those that they have ready for a buyer to move into.
New construction supply shows a buyers market! I haven’t seen this kind of number in a VERY long time. Ever?
Things are different when you look at previously owned homes. It is still a sellers market, although not the insane sellers market of a year or 2 ago. Homes still get multiple offers, the market is still moving just not at a runaway pace. Previously owned single family homes are sitting at about 1.3 months supply. So you can see the difference here.
WHY is it a seller’s market for existing homes and a buyer’s market for new constructions?
What leads to this? 80% of people with a mortgage on their home are paying less than 5% interest, 50% of them have a rate at less than 4%, they need a big incentive to list their homes and buy a different home with a mortgage at a higher rate. This really is one of those cases where as usual, of you have a good budget you are at an advantage because you can buy new construction and take advantage of the market and the incentives whereas those 2 things don’t exist as much for existing homes, prices are lower as a median but supply is lower too and you don’t get the builder buy downs. But you also don’t have to pay for a deck or the multitude of finishing touches that need to be added to new construction.
Price reductions
Housing inventory is dropping now as we get into the winter and holiday time, but the other thing that is slowing is PRICE REDUCTIONS – the percentage of them is reduced by about half of what it was 1.5 to 2 months ago, from 14% of listings to about 7%. Maybe agents and sellers are pricing correctly now, or maybe they understand that they may spend more than 5 minutes on the market?
Bank owned homes
Another statistic of note are the number of distressed or bank owned properties. We still have fewer than 100 listed out of about 6200 active listings. Less than 1.5%, other markets in the US are not faring as well. People here are still meeting their mortgage payments.
Offer terms that show a big shift
OK – a couple of other things that really stand out to me – the first is that sellers are contributing to buyers closing costs 43% of the time! that’s the highest percentage I can remember seeing. People including appraisal gap language on there offers has almost disappeared (although escalation clauses are still being included) but this makes sense when you see that most sellers are now seeing themselves getting about 99-100% of asking – this number was at 105% or more for a while and that was just crazy. Another option if you are in the previously owned category of home, if you find one you like and it has a motivated seller you could ask for them to do the rate buy down for you. Interest rates have been dipping back down, but it’s doubtful that they will ever get as low as they were during the pandemic. This will likely spur some more buyer activity as we head into spring.
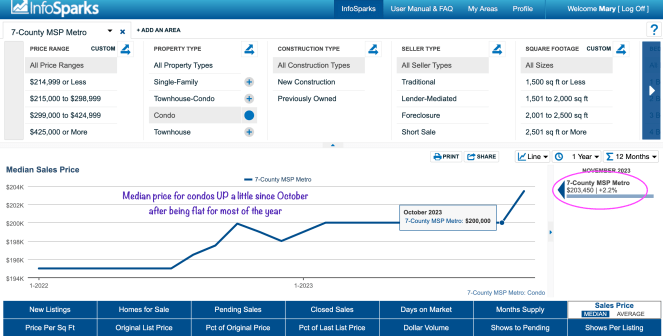
Data on Condos and Townhomes
If you have questions about the real estate market in the Twin Cities area – city or suburbs! – reach out! I love to talk to people that meet me YouTube or the Blog! Mary
A month goes by in a hurry it seems, so here we are! Did a month make a difference with the real estate market? YES. It is notably busier!
Click here to watch. 🙂
I don’t think I’m telling you anything you don’t already know, but the real estate market is on fire. Someone hit the gas pedal on the housing market in February and they have a lead foot. What does this mean specifically? Let’s look at the twin cities housing market as of Feb 18 2022.
If you are a seller – LIST NOW and you’ll be partying all the way to the bank.
Just about every listing is getting multiple offers in the first couple of days. The supply of buyers is so great and the supply of homes is so low right now – 15% fewer listings on the market than last year at this point!
Why are sellers hesitating? I assume that it’s because they are worried about finding THEIR next home. As an agent that represents a lot of buyers, I can tell you that sellers can not only command great prices for their homes they can still get a closing date that suits their needs. For example, if a seller is considering putting their home on the market, but are worried it will be gone in a blink, there is a great likelihood that the seller can ask for and receive a 60 close, flexible closing, or recently I’ve seen them asking for a seller’s home purchase contingency or lastly a rent back situation after closing remembering that most conventional loans require the transaction to close in 60 days on the buy side so no long term rentals this way! but this way the seller will have cash in hand and be able to buy while also have a roof over their heads while they wait for their next home to be available.
One of the things that I really like about real estate is that EVERYTHING is negotiable – as long as the parties work it out (within the law!) and get it in a signed contract, the parties can work together to find a solution that works for everyone. Do you have a creative way to structure a contract that lets everyone get what they need? Bring it up and there may be a way to make it work out!
This past week we had offer acceptance rates at 15%, which means that sellers are receiving 6-7 offers on average. But the average for the month is hovering around 35% according to Home Free Transaction Coordinators. I’ll give you more info on what they see in a successful offer after I take you through current market conditions.
Absorption rate
It’s a seller’s market, but to what degree? In the past I’ve explained that the way that we determine this is based on the absorption rate or how many months worth of housing inventory we have at a given time if nothing new were added to the market. 5-6 months is considered balanced, more than that is a buyer’s market and less is a seller’s market. Obviously the more extreme the number the more it favors one or the other. That obviously varies by housing type.
Single family homes have a .56 months (about 17 days) supply now as compared to one year ago when they were at .62 (about 19 days). We have started this year off with available inventory down by 21% year over year. New listings this month are down by 15% from last year.
I was looking for a bright spot and looked at new construction. Builders are responding to the need for houses and have started increasing their production too.
This image shows the big dip and now the increase starting in single family new builds between $400 & $600K. Its not dramatic, but any amount helps – if you have 50 more houses that’s 50 buyers that have found something.
If you have been thinking about selling and are curious about what your home is worth today, let me know. I’ll give you a free estimate of what your home is worth today – absolutely no obligation, just for your information if you want to know – just send me an email. We need homes and now is definitely the time to get the maximum amount of money out of your sale! mschumann@kw.com if you’re curious. I’m happy to do it.
Townhouse/ Condo properties are at .97 months (29 days) vs 1.13 a year ago (34 days). Prices on Townhouses are at a median of $267,000 which is UP 12.2%. Average days on market for a townhouse is down 26% to 14.
Condo prices are at a median of $195,000 up 6.6% from last year and are on the market for about 30 days. If you are a first time buyer or someone that likes condo living, this is the softest spot in the market today and your biggest opportunity.
Single family homes in the 14 county metro area have a median price of $370,000, a gain of 12.1% year over year. They are on the market for NINE DAYS. Only about half of what we saw a year ago. And don’t fool yourself thinking you have 9 days to think about it, this is a listing going live on a Thursday, showing through the weekend, closing offers on Sunday and allowing a 5 day inspection period before heading to pending.
The combined absorption rate (all property types) is at .67 months or 20 days of inventory as opposed to one year ago when we had a whopping .75 months or 22 days of inventory.
What can you do if you’re a buyer?
Here are my suggestions and strategies:
1.my office posts properties to agents internally that are off market and that sellers are willing to part with before going onto the MLS, so having that network available helps a lot!
2. make sure you see what is available in “coming soon” and get in there quickly
3. even better if you have the nerve- offer “sight unseen” while in this status. if the seller will do it, you can usually negotiate an inspection this way and if there is something wrong with the property get out of the contract without losing your earnest money, this does require a good offer out the gate. It’s not a way to get a bargain, but is a way to quit losing in multiples.
4. make your offer more appealing are to offer appraisal gap coverage. This means that if you are financing you are stating that you have the ability to make a larger downpayment in order to cover the gap between your offer and what the bank is willing to loan you, having cash is a very important piece of the puzzle in this environment. You can offer any amount of appraisal gap coverage – it doesn’t have to be 100% of the difference!
5 Look at “wallflowers” these are properties that have been on the market for longer than 4 days. This means they have made it through a weekend without getting an offer and may be more willing to negotiate or look at a reasonable but not extreme offer. These can be homes that a buyer got cold feet on, that their financing fell through or other scenarios.
6. Don’t ignore properties that need work! You can get a home loan that rolls a remodel into it. Not everyone can look past a dirty unfinished basement but it’s rarely a bad investment to add finished square footage to a house – especially in an in demand neighborhood.
7. Do you have time? Offer on new construction. You eliminate multiple offers and choose your finishes. Just be aware that contracts allow builders to cancel your contract if the price of materials goes up and you can’t cover the increase. Don’t get yourself in too deep.
8. There aren’t a ton of these available but spec houses are a good option. They may be completed new builds OR they may be nearly completed with an estimated move in date already.
9. my last option coming to mind to look at loans that allow you to offer as if you’re offering CASH – without a financing contingency. This seems like a HUH??! moment, but in my video next week I’ll interview a lender with a program like this that may give you a leg up and I’ll post it here, of course!
Accepted offers
OK – lets look at what’s been going on with offers per HFTC:
Buyers are waiving inspection 46% of the time, this is a lot, but that also means that 54% of the time they are getting an inspection.
Off market sales are at 12% – this is the “private listing network” that I mentioned where agents that have upcoming listings market them internally first.
Sales Contingent on the sale of the buyer’s home is down to 5% of the time.
Average sale to list price is 103.2%. I don’t know where these are happening because my buyers have been offering at 15% over and losing… We would be happy with 103%!
Cash is at 17% of offers, Conventional at 69%, FHA has ticked up to 5%, VA is at 0.
Hey! I would love to hear from you in a comment or an email or a smoke signal … reach out if you have questions!
Hi and happy new year! Who wants to start the year off with some DATA and a look at what the real estate market is doing PLUS what I believe will happen with the housing market in 2022? I actually LOVE data – it tells a very clear story, so let’s dive in and take a look at what that data is telling us.
Prefer to watch rather than read this? 😉
I wish I had a crystal ball to tell you what is going to happen to the real estate market in 2022, I don’t, but I will make some educated guesses! In addition to that I’m going to share with you what the offers that have been accepted have looked like in the past month.
I like that info because it is ALSO a gauge for how strong the market is – what are sellers wanting to see and what are buyers willing to do to win?
Sisyphus at work
in 2021, being a buyer (or a buyer’s agent!) could feel like pushing a boulder up hill. It was hard, tiring, a little stressful but it was ultimately satisfying if everyone hung in there (I’m stubborn – I don’t quit).
It’s me. I’m stubborn like a mule.
The market was really rough for buyers because demand for homes here is HIGH and supply is LOW. I think many of us went into this winter hoping for a bit of a break on the horizon, but the numbers are not making it look like that will be the case.
Inventory of homes was really low LAST January first – historically low! and as of the first week of january this year we have 15% fewer listings on the market to choose from than we did then. We are still in a ridiculously strong seller’s market.
Fun fact – the last time the market was considered “balanced” in the twin cities was 10 years ago. It has favored sellers ever since and doesn’t seem to be lightening up at all.
As a colleague said today, there is a lot of national press saying that the market is loosening up but the numbers tell a different story.
Do tell, National News!
It’s important to look at DATA for the market you’re in and understand what that means for your situation. So let’s look at the data for the twin cities – you know that price is a function of supply and demand, and we have already established that supply is low. It has been consistently low for years and the recent challenges with supply chain and lumber prices are not helping supply to correct that quickly. It’s going to be a long term process.
Absorption Rate
Realtors look at how many months supply we have of homes available to sell if NO OTHER HOMES ARE LISTED in order to determine what kind of market we are in – 5-6 months is considered a balanced market, fewer months worth of inventory favor sellers and the smaller the number of months the more strongly it favors them, and vice versa for buyers.
Currently, the total months supply we have now including ALL property types is 8/10 of one month. .8 months is WAAAAAY less than 5-6 months.
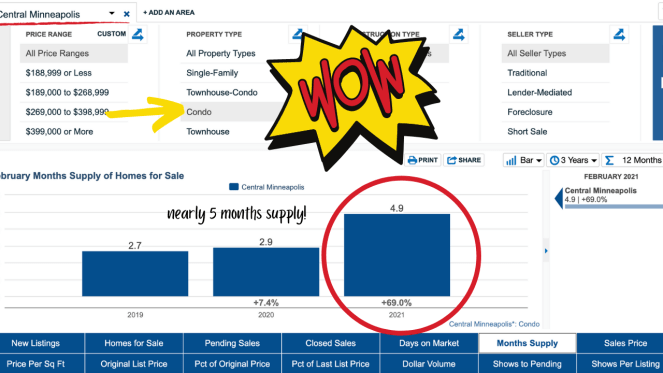
If you break this down further you see that single family homes are at .7 months supply this year (one year ago we had 9/10’s of a month), Condos have been the softer spot and currently have a 1.6mo supply down significantly from a year ago when we had 2.8 months, and townhomes are just like single family homes with .7 now vs .9 a year ago.
An interesting thing to me is that high end homes are seeing the market tighten up a lot now too. That area had more wiggle room last year, but it looks like that is no longer the case.
Broken down by price point
Median price by property type
If we take a look at prices we see what this high demand has done over the course of a year, single family homes are at a median price of $360,000 UP 10% year over year from $326,300 (emphasizing that this is a MEDIAN price for the entire metro area, obviously prices range widely!)
Townhomes show a similar increase of 8% from $240,000 a year ago to $259,900 now.
Condos despite being the soft spot ALSO rose in price – they are at $191,000 up 11.6% from $171,000 a year ago.
Demand side of the equation
The other side of the equation is DEMAND. What leads to this high demand?
A couple of things that I can think of the first of which are the low interest rates. The Fed is talking about raising them this year but even if they do, these changes are typically incremental as they test to see the effect on the markets for everything – not JUST homes.
If the rates rise a bit – even to 4%? will that tamp down the demand for homes?
I personally don’t think it will have an enormous effect, the demand is so high, and even 4% or 5% are STILL low interest rates. In the past I have paid interest at 8.25% for my first home, 6.5% for my second, we paid 4% and thought we had a steal when we moved to MN! Yes, we refinanced when the rates dipped again, but you get my point. It’s relative, and people want a place to live that belongs to THEM and gives them essentially rent control and a predictable expense PLUS the joys of having your own home.
The second factor in demand is the fact that a very large bubble of millenials is aging into a time when they want to do the things that people do in early adulthood – get married, have a family, BUY A HOUSE. This bubble, or boom, is driving demand for homes.
Tips for BUYERS
If you are thinking of selling, your property will likely get scooped up VERY quickly this year. If you are thinking of jumping into the pool to BUY, I have some advice:
1. Understand that you are going to be in a difficult situation, you aren’t the only one looking at a house and if you decide to offer on it you will be competing with many other people. Do your best.
2.) steal yourself for the process. If you don’t get the first home you offer on, it will likely hurt a bit, get back in the saddle and try again. SOMEONE wins every one of those multiple offer situations – that someone CAN be you. You just need to have the chops to hang in there and keep swinging. If I’m working with you, I’m going to have your back every step of the way and help you present your offer in a way that makes the seller say – YES – that one!
3.) very important! Look at homes listed UNDER your max price. Almost NOTHING goes for list price right now, so you need to put yourself in a position of being able to offer over list.
4.) A corollary to #3 is that you should save as much cash as possible so that you have that wiggle room to cover appraisal gaps or increase a budget and put a smaller percentage down if you need to.
5.) lastly, don’t stop looking at the times when everyone else has stopped looking! If it’s a holiday or WINTER, now is a good time to look because you are competing with fewer buyers even if the supply is lower, too. I love to look on holiday weekends – sign me up for Memorial Day! I’ve not really had a break over the Christmas season this year because listings are selling now as well as buyers getting homes while everyone else is hung over from too much egg nog. STAY IN THE GAME. Take advantage of the situation.
Offers that are getting accepted NOW
Let’s look at what types of offers are getting accepted right now according to Home Free Transaction Coordinators – what are sellers looking for and buyers offering in the effort to get a home?
Offer Acceptance Rate: 52% this indicates multiple offers to me. We have been quite low on this in the recent past – under 30%
Inspections were Waived 30% of the time – summer was over 50%, now seems like a good time to buy if you REALLY want an inspection
Pre-MLS Sales: 4.4%, these are sales that happen off market, private network of agents marketing them to each other.
Average Purchase to List Price is the lowest I’ve seen this year at 100.87%, this was up around 105% in summer!
Financing Types:
Cash 19% – this is the highest I’ve seen and I can say that it reflects my own personal experience recently.
Conventional loans 73% – still the big daddy, and always will be.
FHA 2% still tough to get these accepted and that kind of stinks, but when you’re going up against cash, I can’t blame a seller.
VA 4% this is the highest I have seen in a year at least.
USDA 1%,
Other 1%
Seller contribution to Closing Costs: 37.8%, this can be in lieu of fixing something.
Home Warranties included in the sale 5.6%
Offers Contingent Upon the Sale of the Buyer’s Property are at 6.7% – this is actually DOWN quite a bit, I believe not too long ago it was around 10-12%. Try to avoid this of possible. It’s really tough to get accepted.
If you’re exploring communities, check out my neighborhoods and suburbs playlist on YouTube to take a look at different areas of the metro.
Let me know if you have questions or comments – love to hear from you!
Let’s talk about the Real Estate Market in the twin cities! It’s been a little bit since I’ve done one of these updates, and typically there is some seasonality to the real estate market, with a big slow down in the fall as holidays approach and things picking up in the early spring. Is that the case this year? Let’s find out!
So, how’s the market? If there is one question every agent hears all the time, this is IT! And I think everyone knows the market has been GREAT for sellers and really rough for buyers, so the question is has that changed? The information I’ll give you here applies to the 7 county metro area, but you should know that every neighborhood has its own micro market and behaves a bit independently from the whole, this information is just a snapshot of the general market behavior right now, if you’re curious about your own little niche – let me know and I get you more specific #’s that apply to your specific area in the metro – just send me an email about that and I’m happy to help.
I was able to get a look at some historical data comparing this year to 10 years ago and one of the things that stood out were that the # of active listings that are available to be sold has continually decreased to nearly HALF of what we had then – we had 10,229 homes to choose from in 2016 and now have only 5,692. This isn’t sudden, it’s a distinct trend line going down over the past 10 years. The inventory issue did not sneak up on us and it isn’t going anywhere.
If it’s prices that are freaking you out they peaked in summer and we are now seeing the fall dip. So this could be the time to get a better deal on a home than getting into the scrum with everyone else during peak season.
If you remember from other updates, I like to reference the “absorption rate” how many months would it take for the market to sell or absorb all the homes for sale on the market if no others were listed?
5-7 months worth of housing inventory is considered “balanced” and any number of months less than that indicates a sellers market and a number HIGHER than that is a buyers market.
Right now we have 1.03 mo supply of single family homes, 1.34 mo supply or condos and townhomes, and 1.12 combined mo supply of homes total. A very distinct sellers market! STILL! but better in some degree than earlier this summer when it was less than one month – somewhere around 2-3 weeks, and that takes into consideration days on market and active contingencies like inspection. Reality was that things were sold in a couple of days. And that is STILL the reality depending the price point, condition and the location of the home.
Pricing Trends
Median Price for Single Family HomesMedian Townhome PriceMedian Condo Price
Let’s look at what sellers are deeming a good offer right now:
Offer Acceptance Rate: 62% -this has been as low as about 33% this year
Inspections Waived: 31% which is down from the highs over 50%. I am still seeing this come up a lot in multiple offer situations, and if people are bidding on a competitive house getting an inspection can still be a sticking point.
Pre-MLS Sales: 2.74% – this is lower than it’s been for most of this year – we have seen these off market properties make up around 5% of sales over most of the summer
Average Purchase to List Price: sellers are getting of their asking price 100.67% – great news for buyers and not awful news for sellers. You’ll probably get your asking price.
I will say that this is much MORE likely if it is a single family home as condos and townhomes are still soft spots.
The most recent 3 transactions that I have had have ALL had multiple offers, (7-9 offers), one had an accepted offer at 10% over list price, one at nearly 6% over list and the last I don’t know the outcome because we didn’t get it but we offered (and lost) at 10% over list and were told they accepted a cash offer with NO contingencies (no inspection!).
All of these homes were in the tightest price bracket of $300-$500K. No matter what the statistics say this continues to be an area of really fierce competition when it comes to homes that are in high demand areas and in good condition.
Financing Types:
Cash 14%, – if you have the means to make this kind of offer it can really give you an edge. I am aware of some mortgage products that allow you to make a cash offer so if you’re in a competitive price point, and feel like this might be the answer, know that there are options out there and I give help you find out about this.
Conventional loans are still the big dog at 74% of loans.
FHA represented 10% of the accepted offers which is a nice bump up! This is great to see for people that may be first time buyers and need the extra room that an FHA loan grants them. It’s just been difficult to get an FHA loan accepted in this market when you’re being outbid by people that can guarantee appraisal gaps or provide other financial incentives (like cash purchases!).
VA 1% still a tough spot to be in , if you’re not familiar with VA loans, they are a zero down loan. This is a really tough spot when appraisal gap coverage is needed, so if you’re in a position to take any other type of loan, that would probably be beneficial to your offer.
USDA 0% – these are typically on land or rural purchases, seeing a low number here for a metro area is not surprising.
Other = 1%.
Seller Paid Closing Costs: 31% – this keeps going up!
Home Warranties: were included 9.6% – another statistic on the rise – so these indicators all show a very slight softening from the harsh days of early summer for buyers
Contingent Upon the Sale of the Buyer’s Property: 7.5% A little lower than we’ve seen in other months, but present!
Thanks for stopping by! If you’re interested in learning more about the different neighborhoods and suburbs around the twin cities, check out some of my videos highlighting those! I have a playlist dedicated to this with lots of good information if you’re thinking about making a move.
Is the feeding frenzy OVER?!? Not quite, but it seems to be a LOT better? Of course that is relative! and in this case I mean relative to the crazy times we were in in March – May!
In this video and blog post I’m giving you the current conditions of the market for the 7 county Twin Cities area broken down by property type and then I’ll go into a bit about what we see as far as what terms are resulting in accepted offers right now. These are the encouraging signs I’ve been looking for!
This year has definitely been one for the books! It has been the strongest sellers market that anyone I know can remember – and this is AMAZING if you have a home to SELL! Prices are higher than ever and you can dictate the terms for the MOST part – HOWEVER! Buyers! Do not despair! Things ARE getting easier for you now (at least compared to a couple of months ago when it was an all out SCRUM!)
A note about these graphs – I chose to make them show monthly ups and downs without the smoothing effect that softens the seasonal aspects, so keep that in mind as you look at the dips and heights. the market changes constantly, and this shows those changes month to month.
The median SFH price in the Twin Cities sits at $380,000 – that is UP from $326,100 at the beginning of this year.
Median Price TC Metro Single family Homes
You’ll often hear me talk about the “absorption rate” or the # of months supply of housing available to be sold if no other homes were to go on the market. For context it is considered a BALANCED market if there is 5-6 months of supply. We have been UNDER 1 month for different segments of the market for much of this year, mainly anything under about about $600K. Right now we are STILL at .8 months for anything under about $400k. For single family homes in general we are at a little over 1 month’s supply of homes.
Months supply of Single Family Homes
Homes are only on the market for FIVE DAYS!!! a year and a half ago it was FOURTY FIVE! And only 6 months ago around 20! So still homes are still flying off the market.
Days on market – SFH
Let’s look at the 2 softer spots – Townhomes and Condos.
The median price for a townhome is consistent with the rest of the market rise in prices and is at $271,000 from $240,000 in January.
Median Price for Townhomes
For Townhomes there is a little uptick in supply and we have a full month available right now.
Months supply of Townhomes
Condos! This is the place if you’re looking for any kind of deal! Sellers are negotiating! You can get an INSPECTION! 🙂 Condo prices are at $171,000 for a median price, up a similar amount from the beginning of the year as other property types are.
Condo median price
The supply of condos is where the opportunity comes in – Still a sellers market but for people selling condos it can feel like a whole different world. There are 2.5 months worth of inventory available. This has dropped a small amount since January but has been relatively flat this year overall.
Months supply of condos
Now let’s look at what kinds of offers are being accepted!
This is a valuable bit of information that the Minnesota Transaction Coordinators gives us on a regular basis and I’ll add my 2 cents to about what I am seeing (although as a much smaller segment of the market)
Offer Acceptance Rate: 42%
Inspections Waived: 31% – we haven’t been in the 30% range since March
My 2 cents: the last 6 contracts (this past month or so) that I have either written or accepted have had inspections included and accepted. that’s 100% of my sales in the past several weeks. I’ve been thrilled for my buyers and I am 100% fine with it for my seller as well because I feel like inspections protect EVERYONE, the buyer, the seller and ME.
Pre-market Sales that happen without hitting the MLS : 2.8%. This is DOWN from earlier this year! It was over 5% for quite a while – maybe due to pandemic fears about having too many people in a home?
Average Purchase to List Price: 102.7% – about the lowest it’s been since the spring market!
Still great for sellers, but also good news for buyers! And a lesson to sellers about pricing appropriately. Things change, you want to not have YOUR home sit because it’s been priced too high as well as understanding that unless you have something really special that the insane bidding wars may be over for now.
I have talked to many agents saying that showings are down from earlier this spring when agents were setting overlapping showings and having the home packed full of people for 12 hours per day. Now there are private showings again. There may be open spaces in the calendar. More than one offer may come in but they aren’t seeing the literal STACKS of offers that they were before.
Financing Types:
Cash 11.5%, which is higher than it’s been
Conventional 68.5%, – a little lower than its been
FHA 8.5%, higher!
VA 3%, Still a rough spot! People that use VA are often choosing it because it is a no downpayment loan, which means they are short on cash. If you can’t make appraisal gap guarantees, or add other sweeteners that need ready cash available this can be a VERY tough time to buy.
USDA 8.5% (this is a high number and I wonder if it is a function of the sample size that they had – if they had 2 transactions it could hit this #). These loans are generally for rural buyers.
Seller Paid Closing Costs: are at 12%
Home Warranties: 5.7% – I was able to negotiate this recently as well!
Contingent Upon the Sale of the Buyer’s Property: 8.5% (this seems HIGH to me! I’m still cautious about having this particular contingency, it can be a real weak spot in an offer if you have any competition at all. I would avoid this at all costs or you may have to make it an offer they can’t refuse due to price, or magically find a seller that wants to stay a little longer.
And that is ALL for this week. I’ll be back next week with some more neighborhood profiles. I’ve been AWOL due to this insane market and actually getting a vacation for the first time in YEARS. No regrets. 😉
My last post & video about this were pretty well received, so even though numbers aren’t flashy, I’m going to try to make this a monthly feature as we navigate through this crazy market. This post has some good little nuggets in it if you’re in certain segments of the market, so stick with me.
There is an obvious lag in the data because we need to look after homes close and that shows up in the MLS, but I do get some data relatively quickly thanks to Minnesota Transaction Coordinators, a company that helps many of us with processing our transactions.
Let’s start there with their analysis of terms that they see in contracts.
Inspections
In the past couple of months we’ve seen quite a few buyers deciding to waive the inspection in order to release one more contingency ahead of everyone else. By “a lot” I mean 38% of buyers were waiving inspection in the first 2.5 weeks of the month, but when they looked at the first through the 26th the rate went to 31%. That means that enough people have STOPPED waiving them to lower this percentage by 7%. Buyers are insisting on protecting themselves and sellers are acquiescing to that.
Offer acceptance rates
Even better, offer acceptance has gone from 31% for the month last week, to 39% for the month over all as of the 26th. YAY!!!! Sellers are accepting offers! I represent a lot of buyers and it has just been TOUGH. So this is great news.
Homes listed on the open market vs witheld
In an office as large as mine, we often hold listings off market and only market to agents within the office. This shrinks the pool of who looks at the house which is desirable for a lot of reasons – from Covid, to privacy, to simply wanting to not have to deal with the preparation and hassle of selling on the open market. Sellers can name their terms and if another agent has a buyer that can meet those, there is a happy meeting of the minds without all of the associated prep work, exposure, etc and everyone feels satisfied. The number of sales that they have worked on in this status is down to 5.6%. This is good because more homes are hitting the market than have been.
Percentage of list price received
Current purchase price to list price ratio is “down to” 104% from 105% last week. It has been hovering between 103% and 105% in the past couple of months. It’s good to have that number in mind, even though it’s not a fixed price, it’s an idea of what you should think about when offering on a property that has a lot of interest. Price is not the entirety of a an offer, there are a lot of other terms that need to be in line as well, but this is good info for this metric.
Seller paid closing costs
26% of deals include some seller paid closing costs. I have to assume in this market that the offer price was increased to account for these, but I like that we are seeing it because it means sellers are accepting these terms.
Forms of financing
76% of loans are conventional (you do NOT need 20% down for a conventional loan! These are viewed as more favorable and if you can get a conventional loan it’s one more check mark on the list of terms).
FHA loans represent 10% of the offers, CASH 10%, and VA & USDA loans are at 4%.
Traditionally, inventory really increases around this time of year (inventory = homes being listed and available for sale). We currently have less than HALF of the listings we had 6 months ago.
Good news for downtown condo buyers!
Downtown condos are in a balanced market right now! If you are looking for a condo in the central city including neighborhoods like Loring Park, Downtown, University, Dinkytown, Elliot Park etc… now is the time. We believe that this is caused by the pandemic and people wanting to live in less dense housing + fewer people needing to be downtown for work, but don’t expect it to last with the speedy rollout of vaccine and life returning to somewhat new normal.
Days on Market are up to 41 (only from 38), but these are the kinds of indicators that let buyers know that they will not likely have to pay more than list, that sellers will be willing to negotiate because they know you can find another condo to buy and someone will play ball with you.
So that is what is happening! Sellers are still mostly in control of things, but if you’re a downtown condo buyer you’re in the sweet spot!
Next week I’ll give you another neighborhood profile – I’m excited about my small town series, and I have one I love and plan to talk about, but this week I’m going to beat a dead horse a bit and talk some more about what is happening in the real estate market in the Twin Cities metro area. I don’t usually do “market update” posts or videos on my YouTube channel, but the fact of the matter is that right now I’m actively helping 6 buyers try to navigate this market and I want to share a bit of how we look at the market and measure it and then also show you what that means for the Twin Cities right now.
I swear … it was this big!
I feel like anecdotal evidence about how many offers a listing gets, how fast something sells or how far over list price the offers are is shocking at times or maybe sounds like a fish tale that we like to tell – “the big one that got away” kind of thing. Stories are great and interesting, but in this post I want to talk about DATA. Weee! Exciting!
Not exciting? Well, I disagree. I think this tells a very clear story and because it looks at the entire market and then breaks it down by price it might tell the story in a way that makes sense in a different way to more people. This is the WHY behind the HOW that I’ve talked about before when I’ve done videos/posts about making the best offer.
How DATA tells you if it is a buyer or a seller’s market: Meet the “Absorption Rate”
These are my words, not something from a real estate dictionary somewhere.
When we look at a market and try to decide who it favors we look at the number of active listings available in a 30 day period and then look at the sales. It’s a ratio. But the way that I think is easiest to visualize this ratio is as the “absorption rate”. This rate shows us how long it would take for ALL houses actively listed to be sold if NO OTHER homes were put on the market during that time.
We are measuring time in months for this exercise, and the magic number of months where REALTORS feel that the market is in balance is 5 (not set in stone, some argue for 6 months etc). This means that when it would take 5 months for every home to be sold should no other homes be listed, the market does not favor either a buyer OR a seller.
Any number smaller than 5 indicates a sellers market. The smaller the number the more it favors sellers. This works in the converse as well, the LARGER the number over 5 the more the market favors buyers.
What is the Twin Cities absorption rate today?
Emphasis on TODAY because this rate changes seasonally and with market forces – I’ll talk a bit about what those are too.
The current absorption rate for the Twin Cities metro is 0.86. LESS than one month’s supply of homes. Very much in the favor of the seller. And it is not getting better – in the past 6 weeks the rate has consistently decreased from 1.32 the first week of January to where we are today.
The last half of 2020 was a crazy market, due to Covid hitting in spring and the uncertainty that brought with it there was a lull in what would typically be the busy spring market, but once everyone got their bearings it was off to the races and it never really slowed, even during the holidays. Add extremely low interest rates into the mix (under 3% for a pretty extended stretch), and a bubble of Gen Y aging into home ownership and bumping up what was already high demand from buyers, and things have just not cooled at all. All of this to say we sold a LOT of homes last year and possibly ate into what would have been inventory for this year. January 2021 started with 38% FEWER listings than we had in January 2020.
Supply continues to drop, particularly in the under $300K price range where new listings are down 15% YTD. The over all market YTD has 6.9% fewer listings. If you’ve taken any economics classes at all you’ll know that price is a function of supply and demand. We have low supply and high demand and that is pushing prices higher as people bid against each other for homes.
Absorption rate by price point
The best way to show this is to give you a screen shot of the table that we looked at in our data meeting this week. I love this table because it breaks it out by general price points and you can see the trend over the past 9-10 months for each. You’ll notice that higher price points have slightly looser markets because there are fewer buyers that can manage those budgets. I do think that the $500-$1M may need to be broken up a bit because at $500K there is still a quite a large bubble of buyers that are able to enter the market and compete for homes at that price. There may be a break closer to the mid $600’s where the ratio gets closer to 1.4, but I think $500 is still quite competitive.
credit to Tim Sipprell who pulled this together for our officebaby data geek
So, that is the data geek light version of the market at this point in time in the Twin Cities. An opportunity again for me to encourage you to be as prepared as you possibly can be before you enter the fray. You really need to be in the best position possible if you want to land at the top of the heap when you get into this market.