market updates · Uncategorized

Minneapolis Real Estate Market Update | October 2025

If youโ€™ve been following national real estate news lately, youโ€™ve probably seen some dramatic headlines: โ€œHome Prices Are Falling!โ€ or โ€œThe Housing Market Is in Decline!โ€
And while thatโ€™s true for many cities across the countryโ€ฆ itโ€™s not the story here in Minnesota.

Here in the Twin Cities, the housing market continues to hold steady โ€” and even grow โ€” while other once-red-hot markets cool off. Whatโ€™s really happening as we head into fall 2025?


๐Ÿ“‰ The National Picture: Markets Cooling Down

Across the U.S., many of the cities that were booming in 2021 and 2022 are now seeing prices soften and homes sit longer on the market.
A recent report listed the top 10 cities with falling home prices (per redfin), and they included:

  • Miami
  • Austin
  • San Diego
  • Richmond, VA
  • Boston
  • San Antonio
  • Dallas
  • Denver
  • Phoenix
  • Sacramento

These are all markets that experienced major appreciation during the pandemic โ€” and now, theyโ€™re seeing the other side of that cycle.


๐Ÿ“ˆ The Minneapolis Story: A Very Different Trend

Meanwhile, here in the Twin Cities, things look much more balanced โ€” and frankly, healthy.

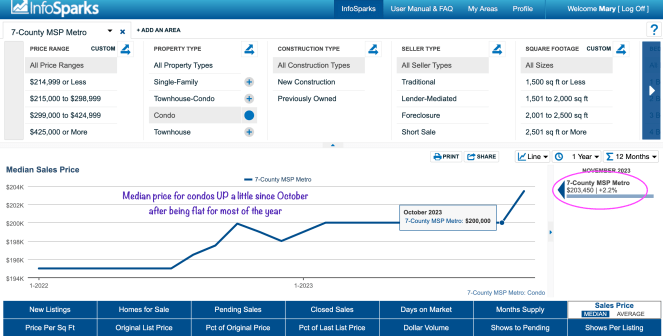
The median price for previously owned single-family homes in our 7-county metro area is up 5% year-over-year, sitting at around $420,000.

Even more encouraging, new construction homes โ€” which saw some price dips last year โ€” have rebounded. The median price for a new construction single-family home is up 5.5%, landing just under $600,000.

So while national headlines sound gloomy, the Minneapolis market remains strong, steady, and appreciating at a sustainable pace.


๐Ÿ  Inventory: The Most Weโ€™ve Seen in Years

Letโ€™s talk about inventory โ€” because thatโ€™s where weโ€™re really seeing movement.

As of early October, there are just over 8,000 active listings across the metro.
For comparison:

  • October 2024: 7,700 active listings
  • 2020: 6,000 active listings
  • 2019 (our last โ€œnormalโ€ year): 9,400 active listings

So while weโ€™re not back to pre-pandemic levels, itโ€™s a noticeable increase.
Every one of the seven metro counties now has more than two months of inventory, with Anoka County being the tightest at exactly two months.

This shift toward balance is a good thing. It means buyers have more choices, sellers need to be more strategic, and overall, the market feels more normal again.


๐Ÿ’ธ Price Reductions on the Rise โ€” But Sales Are Still Strong

Another sign of a normalizing market? Price reductions.

Across the Twin Cities, weโ€™re seeing roughly 1,000 price reductions every single day on active listings.
That doesnโ€™t mean homes arenโ€™t selling โ€” it just means sellers and agents are adjusting to find that sweet spot where supply and demand meet.

When a home is priced correctly and shows well, it still sells. But gone are the days of โ€œlist it Friday, sold by Monday with 12 offers.โ€ This is the kind of market where experience, pricing strategy, and presentation really matter.

Despite more price adjustments, weโ€™re still ahead of last year in the number of total homes sold โ€” proof that this is not a stalled market, just a balanced one.


๐Ÿ•ฐ Is It Smart to Try to โ€œTime the Marketโ€?

I get asked this a lot:
โ€œShould I wait to buy until prices drop?โ€
โ€œShould I hold off on selling until things heat back up?โ€

Hereโ€™s the thing โ€” unless you have insider information the rest of us donโ€™t, itโ€™s nearly impossible to time the market perfectly.

Real estate is hyper-local. Itโ€™s not even just city by city โ€” itโ€™s neighborhood by neighborhood, sometimes block by block.

Thatโ€™s why I always tell my clients: look at your personal timing, your finances, and your goals. Then make decisions based on that, not just the national headlines.


๐ŸŒณ The Bottom Line: Minneapolis Is Steady and Strong

While other parts of the country are feeling the chill, the Twin Cities real estate market continues to show quiet confidence.

We have:
โœ… Rising prices (5โ€“5.5% year-over-year)
โœ… Growing inventory but still healthy demand
โœ… More balance between buyers and sellers
โœ… A steady pace of sales

Itโ€™s not a โ€œboomโ€ or a โ€œbust.โ€ Itโ€™s a sustainable, smart market โ€” and thatโ€™s exactly where you want to be.

If youโ€™d like a more detailed look at whatโ€™s happening in your specific neighborhood or suburb, reach out! I love helping people who meet me on YouTube and my blog understand the real numbers behind the market.

And if youโ€™re thinking about moving to Minnesota, grab my Free Relocation Guide โ€” itโ€™s linked below and packed with everything you need to know about living in the Minneapolisโ€“Saint Paul area.


๐Ÿ‘‹ Iโ€™m Mary Schumann, Realtor in the Twin Cities metro.
If you found this helpful, subscribe to my YouTube channel or reach out directly โ€” Iโ€™d love to help you navigate our Minnesota market with confidence.
๐Ÿ“Free Minnesota Relocation Guide: https://maryschumann.kw.com/twin-cities-relocation-guide

Living in Minneapolis · market updates

The MINNEAPOLIS SPRING HOUSING MARKET is LIT ๐Ÿ”ฅ

I just did a video that gives real life examples of what is happening in the 7 county metro Twin Cities housing market right now and wanted to share it with you. Things have changed QUICKLY!

Let me know if you have questions about the market or how to WIN in this market. The pandemic was a good boot camp for agents that made it through!

Home Buying · Home equity · home selling · market updates · Uncategorized

Opportunities for buyers? Twin Cities real estate market update!

What is happening in the Minneapolis areaย real estate market? I’ve been following several metrics over the pastย few years and there are a few that really stand out to me as indicative of how the market is doing, not just PRICE but what kinds of terms are included in winning offers and I will let you know which terms are revealing the current state of the market here.ย ย 

I’m keeping my finger on the pulse of what is happening in the Twin Cities metro real estate market so you can be an informed buyer or seller.

The number one question that most people have about homes is whether or not prices are falling? I keep hearingย this and for the purposes of this discussion I’m just going to look at the 7 county metro around Minneapolis and St. Paul and we can check the different housing types. Theย firstย is the most popular -SINGLE FAMILY HOMES.ย  When I was digging into data for this update I decided to look at it over the past year and the past 10 years so that I can show you trend lines for both.ย  I’m also going to differentiateย by new constructionย and previously owned because new construction is at a vastly different price point as a whole.ย 

Prices & time on market for existing homes

Metrics that I didn’t talk about in the video are how long houses are staying on the market these days. I do see houses sitting for quite a long time in certain areas and price points but the official numbers are charted here. The graph gives the impression of a big increase in time, but real numbers equate to only 3 more days.

New Construction

I’ll talk about pricing but for new construction I see a lot of opportunity for buyers here! Why? Builders have a lot of inventory right now. They have completed homes as well as homes that are underway with completion dates coming up. They need to get these homes off their books so they can continue to build and the interest rates have slowed things down for everyone, but the big builders are offering rate buy downsย for buyers right now along with all kinds of other incentives, from appliance packages to closing costs.

Things to consider are that these homes are mainly being built inย 3rd ring suburbs and exurbs so if proximity to the city is important you’re less likely to be able to get a new build – or at least one with a big builder that can offer these incentives. There are customย builds on lots here and there in the city.ย 

You’ll see a slight dip in median price ($5000) from the beginning of the year.ย  I have read in multiple sources that they estimate that it would take 10 years of building for the builders to catch up to demand for homes due to the after effects of the housing recession in 2008. We are still that far behind. New construction is showing over 6 months worth of supply but take this with a grain of salt because builders list homes that are TO BE BUILT – so they aren’t existing yet – along with those that they have ready for a buyer to move into.ย 

New construction supply shows a buyers market! I haven’t seen this kind of number in a VERY long time. Ever?ย 

Things are different when you look at previously owned homes. It is still a sellers market, although not the insane sellers market of a year or 2 ago. Homes still get multiple offers, theย market is still moving just not at a runaway pace. Previously owned single family homes areย sitting at about 1.3 months supply. So you can see the difference here.ย 

WHY is it a seller’s market for existing homes and a buyer’s market for new constructions?

What leads to this? 80% of people with a mortgage on their home are paying less than 5% interest, 50% of them have a rate at less than 4%, they need a bigย incentive to list their homes and buy a different home with a mortgage at a higher rate. This really is one of those cases where as usual, of you have a good budget you are at an advantage because you can buy new construction and take advantageย of the market and the incentives whereas those 2 things don’t exist as much for existing homes, prices are lower as a median but supply is lower too and you don’t get the builder buy downs. But you also don’t have to pay for a deck or the multitude of finishing touches that need to be added to new construction.ย 

Price reductions

Housing inventory is dropping now as we get into the winter and holiday time, but the other thing that is slowing is PRICE REDUCTIONS – the percentage of them is reduced by about half of what it was 1.5 to 2 months ago, from 14% of listings to about 7%. Maybe agents and sellers are pricing correctly now, or maybe they understand that they may spend more than 5 minutes on the market?ย 

Bank owned homes

Another statistic of note are the number of distressed or bank owned properties. We still have fewer than 100 listed out of about 6200 active listings. Less than 1.5%, other markets in the US are notย faring as well. People here are still meeting their mortgage payments.ย 

Offer terms that show a big shift

OK – a couple of other things that really stand out to me – the first is that sellers are contributing to buyers closing costs 43% of the time! that’s the highest percentageย I can remember seeing. People including appraisal gap language on there offers has almost disappeared (although escalation clauses are still being included) but this makes sense when you see that most sellers are now seeing themselves getting about 99-100% of asking – this number was at 105% or more for a while and that was just crazy. Another option if you are in the previouslyย owned category of home, if you find one you like and it has a motivated seller you could ask for them to do the rate buy down for you. Interest rates have been dipping back down, but it’s doubtful that they will ever get as low as they were during the pandemic. This will likely spur some more buyer activity as we head into spring.

Data on Condos and Townhomes

If you have questions about the real estate market in the Twin Cities area – city or suburbs! – reach out! I love to talk to people that meet me YouTube or the Blog!ย 
Mary

it’s me. ๐Ÿ™‚